
An Elliott Bay view of Mount Rainier National Park / Rebecca Latson
If you’ve ever checked out the website for Mount Rainier National Park to learn more about this 14,410-foot-tall volcano, you’ll know Mount Rainier is considered “episodically active.” You can tell “The Mountain’s” volcanic processes simmer just beneath the Earth’s surface by gas bubbles rising in mineral springs spotted along the Trail of Shadows at Longmire, stories of climbers warming themselves in steam caves at the summit, earthquakes, and evidence of past, rapidly flowing mudflows known as lahars.
The heavy, water-laden sediments of a lahar possess the consistency of wet cement, yet can move as fast as 45-50 mph (70-80 kph) over long distances, crushing and burying whatever lays in their path with deadly results to any inhabitants living along and near rivers and river valleys within and outside of Mount Rainier National Park. According to the U.S. Geological Survey, lahars have occurred as far back as 11,000 years ago, when evidence of a mudflow “apparently of landslide origin, moved across Van Trump and Paradise Parks and then down the Nisqually River.”
The Electron Mudflow, which took place 500 years ago, “flowed 60 miles (100 km) downstream to the Puget Sound lowland. When it entered the Puget Sound lowland into [what is now] the community of Electron, it was 30 m (98 feet) deep.”
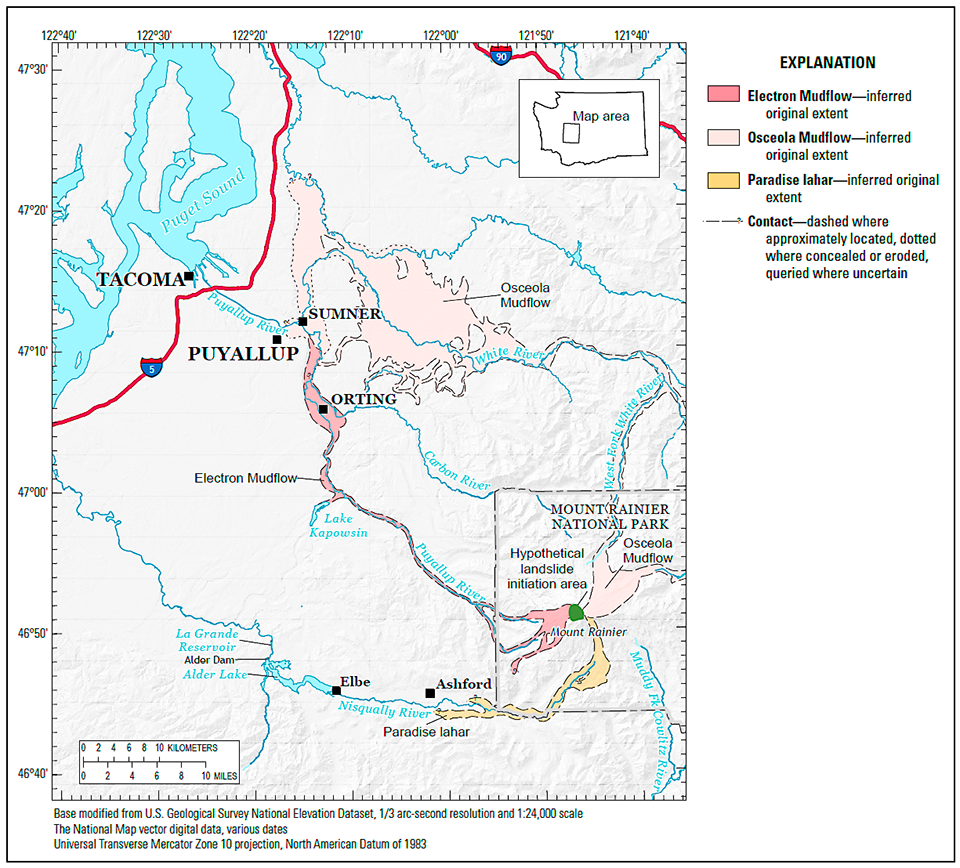
Mount Rainier and surrounding areas of past mudflows / Department of the Interior - U.S. Geological Survey
We may tend to assume it’s only volcanic eruptions, perhaps similar to the one that blew the top off Mount St. Helens in May 1980, that trigger a lahar. According to the USGS, there’s a much greater likelihood that landslides will trigger these mudflows: “Scientists studying Mount Rainier have long recognized that the greatest hazard posed by the volcano is from landslides that begin high on its slopes and transform into mudflows or lahars.”
Lahars cannot be predicted, but they can be detected. The Traveler published an April 2022 article reporting National Park Service approval of a proposal from the USGS’ Cascades Volcano Observatory to improve the lahar detection system at Mount Rainier National Park.
In an effort to accumulate other material pertaining to potentially deadly mudflows arising from Mount Rainier, USGS scientists and mathematicians are currently working together on “simulations of hypothetical future lahars” using a numerical modeling application called D-Claw. This program takes into account such variables as rock volume, type, density, permeability (the measure of the ability of water to move through a rock), ice/snow amount, viscosity (how thick, sticky, or fluid the rock/water material is) and other factors to create different scenarios mapping probable lahar flow routes, speed, reach, and depth through the Puyallup and Nisqually River valleys.
Why these two river valleys and not one of the other river systems stretching from Mount Rainier? Since lahars tend to flow down river drainage systems, these particular two river systems on the west side of the mountain were chosen due to their high population densities posing the most likely areas of “pronounced hazard” in the event of a lahar. And, because the simulation scenarios focused on the western side of Mount Rainier, Sunset Amphitheater and the Tahoma Glacier Headwall were chosen as the most probable locations for landslides.

Location map of Mount Rainier and nearby communities, Mount Rainier National Park / U.S. Department of the Interior - U.S. Geological Survey

Sunset Amphitheater and Tahoma Glacier Headwall, Mount Rainier National Park / Google Maps
Rock density provided a key variable in determining flow distance. Lahars composed of dense, hard rock stabilized before flowing very far, so scenarios incorporating dense rock were labeled low mobility and never reached communities downstream in the simulations. Permeable rock with clay, on the other hand, meant a longer flow distance with much higher mobility (more water in the rock). Those scenarios were labeled high mobility (HM) because the lahar flow simulations reached into and through communities and farmlands further along the Nisqually and Puyallup drainage systems, presenting a much greater threat to a larger swath of landscape.
Below are animated illustrations of two landslide scenarios demonstrating the flow and extent of high mobility lahars, one from a landslide off Sunset Amphitheater and one from a landslide off the Tahoma Glacier Headwall. Each simulation involved 260 million cubic meters (9,180.6 million cubic feet) of rock and ice - a volume similar that of to the Electron Mudflow.
Click on each illustration to see the animation. Note: the speed of your internet connection will determine how quickly the animation loads and performs.

Hypothetical landslide route from Sunset Amphitheater, Mount Rainier National Park / U.S. Department of the Interior - U.S. Geological Survey
With the Sunset Amphitheater high mobility landslide scenario, a portion of the lahar followed the path of the Nisqually River, while most of it flowed down the Puyallup River drainage, arriving at the town of Orting (population >8,000) in a little under an hour, then spreading across the valley between the Puyallup and Carbon rivers. Deposits in this simulation reached depths of six to 16 feet – enough to bury your car … or you. This simulated lahar continued its path, arriving in three to four hours at the Sumner (city pop. >10,000) and Puyallup (approx. city pop. 44,000) lowlands, ultimately slowing, then stopping, four to five hours from its inception.

Hypothetical Sunset Amphitheater landslide and lahar simulation, Mount Rainier National Park / U.S. Department of Interior - U.S. Geological Survey
The Tahoma Glacier Headwall high mobility landslide scenario utilized the same volume of rock and ice (260 million cubic meters). In this simulation, the lahar flowed down the Nisqually River drainage, arriving at the park’s Nisqually entrance in about five minutes, the small community of Ashford (pop. 531) in approximately 15 minutes, and the Alder Lake Reservoir near the community of Elbe (pop. 53) in 50 minutes before moving into the lake to create a rise in water level ultimately overtopping the Alder Lake Dam.

Hypothetical Tahoma Glacier Headwall landslide and lahar flow, Mount Rainier National Park / U.S. Department of the Interior - U.S. Geological Survey
Hypothetical Tahoma Glacier Headwall landslide and lahar simulation, Mount Rainier National Park / U.S. Department of the Interior - U.S. Geological Survey

Hypothetical Tahoma Glacier Headwall lahar simulation flow route into Alder Lake, Mount Rainier National Park / U.S. Department of the Interior - U.S. Geological Survey

Hypothetical Tahoma Glacier Headwall lahar simulation scenario flow route into Alder Lake Dam, Mount Rainier National Park / U.S. Department of the Interior - U.S. Geological Survey
Although these simulations were not capable of addressing such things as the extent of community and farm property damage, and livestock and human deaths, D-Claw’s scenario results did offer data in the form of projected travel times, flow directions, and estimated mud-rock-water deposit depths to aid communities and individuals living within lahar-prone areas in development and refinement of alert systems and evacuation routes.
References
David L. George, Richard M. Iverson, and Charles M. Cannon, Modeling the Dynamics of Lahars that Originate as Landslides on the West Side of Mount Rainier, Washington, Open-File Report 2021–1118, U.S. Department of the Interior, U.S. Geological Survey
https://www.youtube.com/watch?v=RYTbfySHSxU
https://www.nps.gov/mora/learn/nature/volcanic-features.htm#CP_JUMP_476338
https://www.usgs.gov/volcanoes/mount-rainier/lahars-and-debris-flows-mount-rainier


Comments
Interesting article
We don't have lahars where I come from!
Thanks!